| Home |
| Introduction |
| Laws of Forecasting |
| Forecasting Strategy |
| Contact Us |
| Resources |

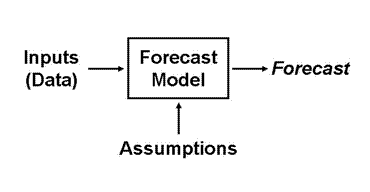
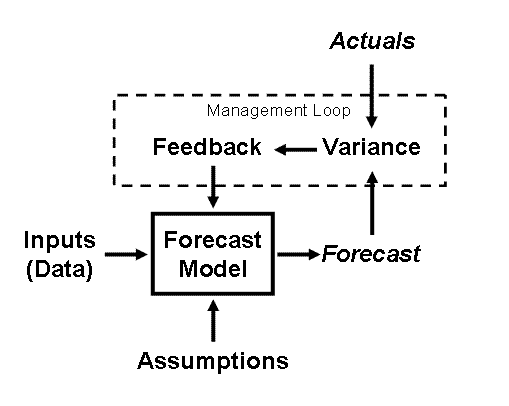
Forecast StructureSince this website is on "practical" forecasting, we will simplify this discussion on structure quite a bit. People have developed dozens if not hundreds of specific forecasting methods over the years, many of which have never been published. In general, they all come down to one of four basic types. The basic structure of a forecast model is shown above. Certain inputs (data) and assumptions feed the model, and a forecast is created of some variable. In the example of the sales forecast, the input might be the number of sales people, the assumptions might include productivity and work hours, and the forecast is the expected sales figure given these inputs and assumptions. With every forecast, though, it is important to manage the process through comparisons of the actuals to the forecast and then working back through the model to understand why. This process is critical to developing a solid forecast methodology. The updated diagram is shown below.  Model Types For our purposes, there are four types of models. Causal models use some specific input to forecast some other entity. For example, you might build a causal model to forecast sales (an output) based on the number of sales people (an input) that are on the staff. This type of model is represented in the diagram above. Extrapolative models take some trend or pattern and extrapolate it into the future. The simplest version of these is the method that we have all used at least once in forecasting -- plot the data, draw a best-fit line through the points, and extend it into the future. There are many sophisticated ways to improve this type of forecast, including methods for incorporating expected seasonal variations, other patterns in the data, or even variations in trend. We'll talk about some of these methods in more detail, and identify some other references if you want to go deeper. But the key thing that all of these methods have in common is that they are extrapolating some identified trend, pattern, or a combination. They are all forecasting something by looking at prior values of that element. Note that the difference between the extrapolative model and the causal model described above is the source of the inputs. In an extrapolative model, the sales forecast would be based on prior values of the sales, and use trends, seasonality, etc. to develop a forecast. In a causal model, the inputs come from other data. The graphic below shows this more clearly.  Intuitive models essentially use the experience of one or more key people to develop a forecast. At its simplest, these include the spontaneous requests that you receive where people want immediate answers -- such as "when are you going to close that big order". The more sophisticated methods use a panel of experts and create a composite forecast based on the collective wisdom of the panel. Although it can feel pretty subjective, these methods can actually be fairly precise, and can be especially good in situations where the facts and factors are changing quickly. For example, if you're about to launch a revolutionary product in a brand-new market, the other quantitative methods might not work very well. Hybrid models use a combination of the methods. A frequent example of this is where a causal model is built that uses extrapolative methods to predict the inputs to the model. For example, a sales forecast might be built with a causal model that is based on the number of sales people. But if it is difficult to know how many sales people might be available at a given time, it might be desirable to forecast that using an extrapolative model. Or, you might estimate the number of sales people based on your intuition, so you would have a hybrid of an intuition and a causal model. In practice, most practical business forecasting models are probably hybrids.
|
